
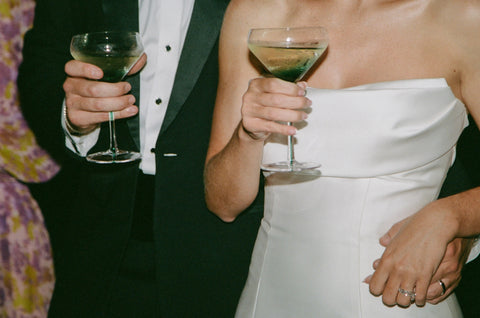


This summer marks the four-year anniversary since same-sex marriage (aka marriage equality) was legalized in the United States, and we’re thrilled to be heading into another wedding season in which LGBTQ+ couples have a place at the table. It’s no secret that here at The Black Tux, we love love, and all of you LGBTQ+ lovebirds hold a special place in our hearts.
So, with you in mind, we decided to determine the best cities for LGBTQ+ couples to tie the knot. To do this, we assessed and ranked the 50 largest U.S. metropolitan areas on eight of the most relevant LGBTQ+ wedding factors.
Read on to discover the top spots in the country for LGBTQ+ weddings.
Table of Contents
i. The Best U.S. Cities for LGBTQ+ Couples to Get Married
ii. Detailed Ranking Factor Scores by City
iii. Detailed Ranking Factor Data by City
iv. Wrap Up
v. Methodology
i. The Best U.S. Cities for LGBTQ+ Weddings
When it comes to the best cities for LGBTQ+ weddings, there are clear winners. Topping the list with a score of 33.8 is New York, NY. Considering the state of New York legalized gay marriage four years prior to the Obergefell v. Hodges SCOTUS ruling, this isn’t all that surprising. Turns out the city that doesn’t sleep is woke.
For the LGBTQ+ couple looking for a wedding location that’s a bit more low-key than New York City, don’t worry — there are plenty of other great options too. From Philadelphia, PA, Hartford, CT, and Providence, RI, in the Northeast to San Francisco, CA, Portland, OR, and Los Angeles, CA, out West, no matter what kind of wedding you’re going for, you and your partner are sure to find the perfect city to get hitched. Each of these 6 options ranked as one of the 15 best in the U.S.

ii. Detailed Ranking Factor Scores by City
After ranking cities based on 8 key factors, it became clear that the Northeast is generally the best area in the country for LGBTQ+ weddings, as seven of the top fifteen cities are tucked in this region. But what earned these Northeastern cities such high marks? Well, in New York City, Philadelphia, and Hartford, the high score averages are a result of the large number of inclusive wedding vendors, as well as the impressive non-discrimination ordinance and equality index scores. And in Washington, DC, the city’s non-discrimination ordinance and high number of same-sex households contributed to its high factor scores.

As for cities with lower scores, Memphis, TN, and Oklahoma City, OK, top the list. With some of the highest hate-crime instances in the country, and poor performance in nearly every other category as well, the only redeeming aspect of these cities for LGBTQ+ couples is their lower wedding costs. (We want to make a joke referencing the musical Oklahoma! here, but felt it would be inappropriate.)
iii. Detailed Ranking Factor Data by City
We know that high inclusive wedding vendor scores helped some of cities come out on top with their overall scores. But how many inclusive wedding vendors are we talking, exactly?

Again, it varies by city. But in New York, the highest-ranking city in our study, there are 126 per 100,000 people. Philadelphia and Hartford, two of the other top cities, have 142 and 113, respectively. Needless to say, if you value having a wide array of wedding vendors to choose from, one of these northeastern cities might be your best bet.
If any of the aforementioned top 15 West Coast cities, like Los Angeles, San Francisco, San Diego, or Portland piqued your interest, then you’ll be pleased to learn which specific factors make these such prime LGBTQ+ wedding locations. For starters, West Coast cities have some of the highest same-sex household numbers in the country. In fact, over 1,000 out of every 100,000 households in Los Angeles, San Francisco, San Diego, Portland are same-sex.
Additionally, the inbound flight availability scores were through the roof in most of the highest-scoring West Coast cities, like Los Angeles and San Francisco, where there are upwards of 19,000 and 15,000 flights to their local airports per month. Although delays and flight cancellations are an inevitable part of long-distance travel, the sheer number of incoming flights in Los Angeles and San Francisco will ensure that all of your guests get into town prior to your ceremony if you choose to have a California wedding.
iv. Wrap Up
When it comes to the best spots for LGBTQ+ weddings in the country, here’s the takeaway: Cities in the Northeast or on the West coast offer some of the most LGBTQ+ friendly wedding spots that are sure to help your special day go off without a hitch. Regardless of which location you decide to go with, however, remember that it’s your day. Your wedding isn’t about where you are, but who you’re with. So if you’re surrounded by loved ones, your big day will be special no matter what.
v. Methodology
In order to determine the best cities for LGBTQ+ couples to get married, we assessed the 50 largest U.S. metropolitan areas based on eight key factors: (1) Inclusive Wedding Vendors, (2) Presence of Same-Sex Households, (3) City Non-Discrimination Ordinance, (4) HRC Municipal Equality Index, (5) Average Cost of Wedding, (6) Inbound Flight Availability, (7) Precipitation, and (8) LGBTQ+ Hate Crimes.
We then rated each of the eight components on a 5-point scale, with a score of 5 indicating the most positive LGBTQ+ wedding conditions. Each city received an overall score based on the total of each one’s individual factor scores, which were weighted according to their significance for LGBTQ+ couples.
The factors are listed below with their respective weight and data source.
(1) Inclusive Wedding Vendors — Weight: 3.00
- Source: Rainbow Wedding Network wedding vendor data
(2) Presence of Same-Sex Households — Weight: 2.75
- Source: United States Census Bureau
(3) City Non-Discrimination Ordinance — Weight: 1.00
- Source: Human Rights Campaign
(4) HRC Municipal Equality Index — Weight: 1.00
- Source: Human Rights Campaign MEI 2018
(5) Average Cost of Wedding — Weight: 1.00
- Source: The Wedding Report
(6) Inbound Flight Availability — Weight: 0.50
- Source: United States Department of Transportation Bureau of Transportation statistics
(7) Precipitation — Weight: 0.50
- Source: City-Data.com weather pattern data
(8) LGBTQ+ Hate Crimes — Weight: 0.25
- Source: FBI hate crime statistics


